As the sky is cloudy I decided to research the behavior of the Starlight
MX716 CCD camera a bit. I want to find out how the different drivers and
software tools compare. As a first analysis I wanted to check the linearity.
The experimental setup is quite easy. The camera is capped with a diffuser
and directed towards a constant light source. Exposures of varying times
are taken. I have the following software drivers available for testing.
Starlight MX716 software
AstroArt 3.0 with plugin driver
The packages have differences that need to be accommodated. In the Starlight software exposures below 3 seconds are by default switched to interlaced reading mode. Progressive scan mode is not available in those short exposure times. This will result in a bit of a lack of data in the diagrams. In the AstroArt plugin no such limitation is present. Both packages offer filters to compensate for VBE. AstroArt calls it 'Low pass Filter' which I set to 'normal filter'. In the Starlight software the function is identified as 'Apply correction to highres. images' which I checked.
Starting with short exposures I went through a somewhat logarithmic
sequence.
0.1, 0.2, 0.5, 1.0, 2.0, 5.0, 10, 20, 50 sec.
The images don't look very interesting. Here is one in reduced size.
For processing the overall average of the image was computed and tabulated in a simple spread sheet.
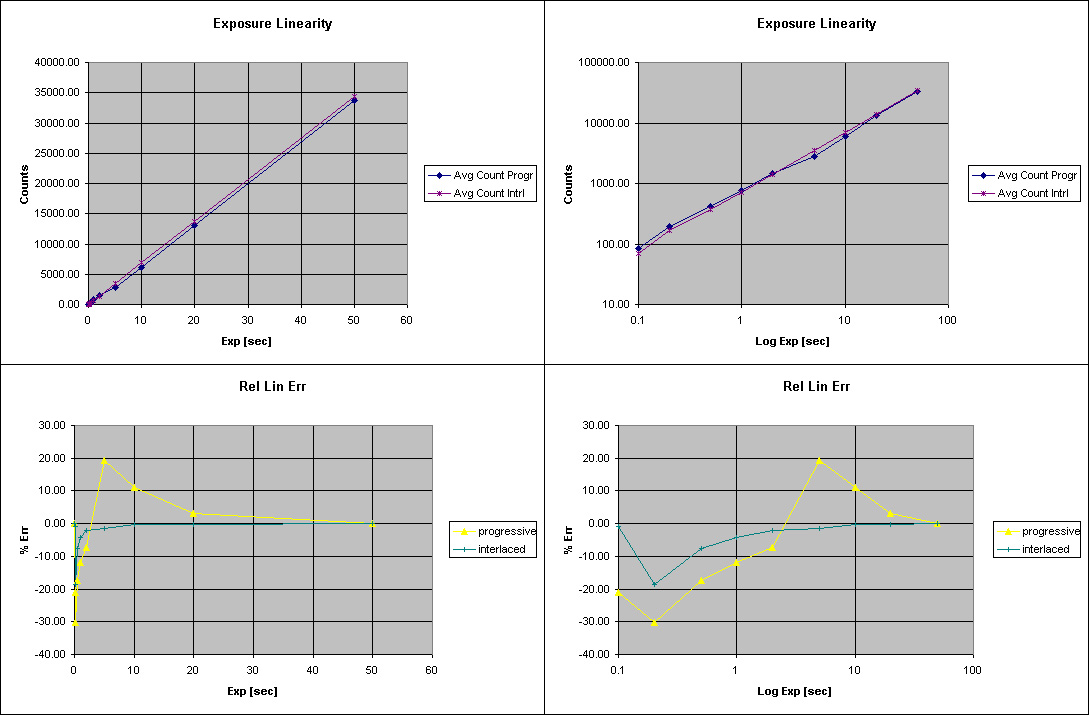
For the linearity I plotted pixel counts vs exposure time. One would expect a linear curve here. To make deviation more visible I plotted the same data both in lin. and log. scale. any deviation from a straight line would already be an indication of a slight linearity error. To make this more visible I calculated an ideal linear curve and subtracted the individual data points from it. This leaves a curve that ideally would be a horizontal line at 0. Any deviation is clearly visible. I set the error in percentage relation to the absolute pixel count for a more comparable scaling.
Now the results. AstroArt 3.0 shows the progressive and interlaced scan as nearly the same slope in the top row of graphs (left lin., right log. scaled). The graph esp. on the right show a slight 'waviness' which implies non linearity errors. When going to the error plot these stand out more clearly. In progressive interlace scan the error seems amplified vs. interlaced scan.
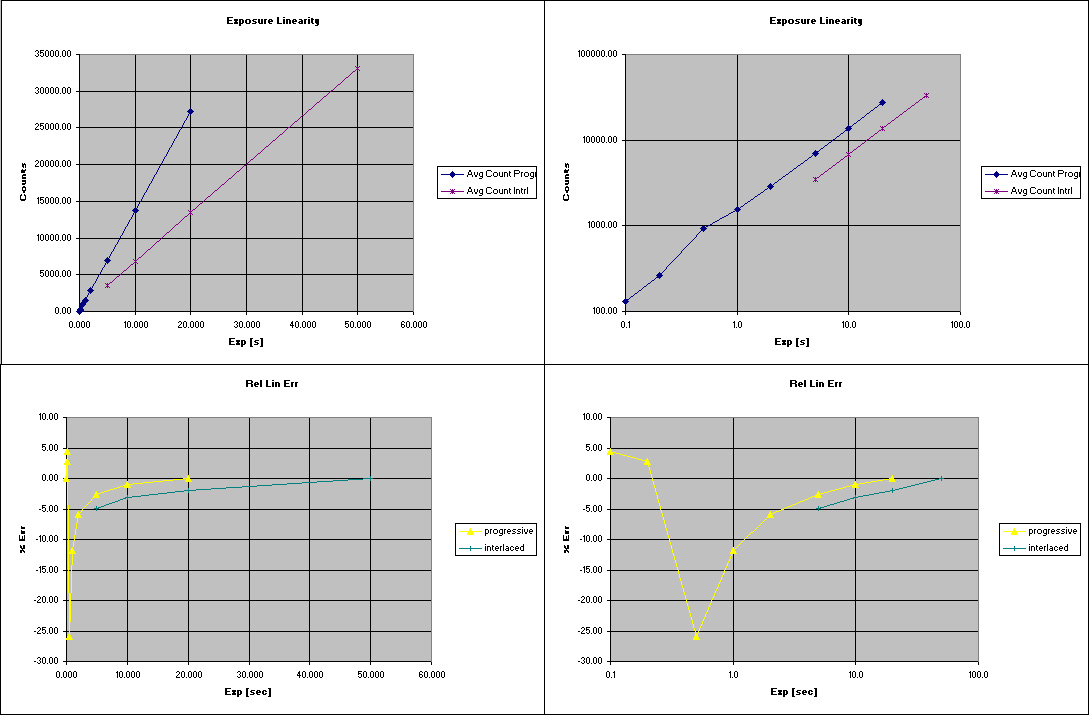
Now the data for the Starlight software package. The first row of plots
shows that here there is a significant difference in pixel count with resp.
to the readout mode. Progressive scan clearly brings out higher count values.
If those are representing actual better data or are just a result of multiplication
in the driver is unknown. Counts for the progressive scan reached saturation
for the longest exposure time of 50 sec. That data point is discarded.
The deviation from linearity is smaller. Compare the y-axis scale in both
graph (bottom row).
Summary
The Starlight software package seems to provide better linearity. Unfortunately it lacks features like filter wheel control that the AstroArt plugin provides.